
SVGs got quite popular in recent years. They have several advantages over traditional image formats and are widely used from icons to illustrations. If you ever inspected one, you might have noticed a path element with a d attribute with a long cryptic text of some letters and some kind of coordinates.
<!-- What will that SVG display? Hard to tell... -->
<svg viewBox="0 0 100 100">
  <path fill="none" stroke="black"
    d="M 10,30
       A 20,20 0,0,1 50,30
       A 20,20 0,0,1 90,30
       Q 90,60 50,90
       Q 10,60 10,30 z"
    />
</svg>
The d property represents the "path definition" and consists of multiple path commands. The MDN documentation on path commands is quite good and gives you a great overview over the types of commands. In short: The definition defines how the SVG should draw lines and arcs. However, it can get quite difficult to understand and to tell how an SVG will look like.
The same happened to Mathieu Dutour, as he wondered what the commands exactly mean and how they work. So he created a neat tool called SVG Path Visualizer. You can paste in any path definition and it will explain it to you step by step.
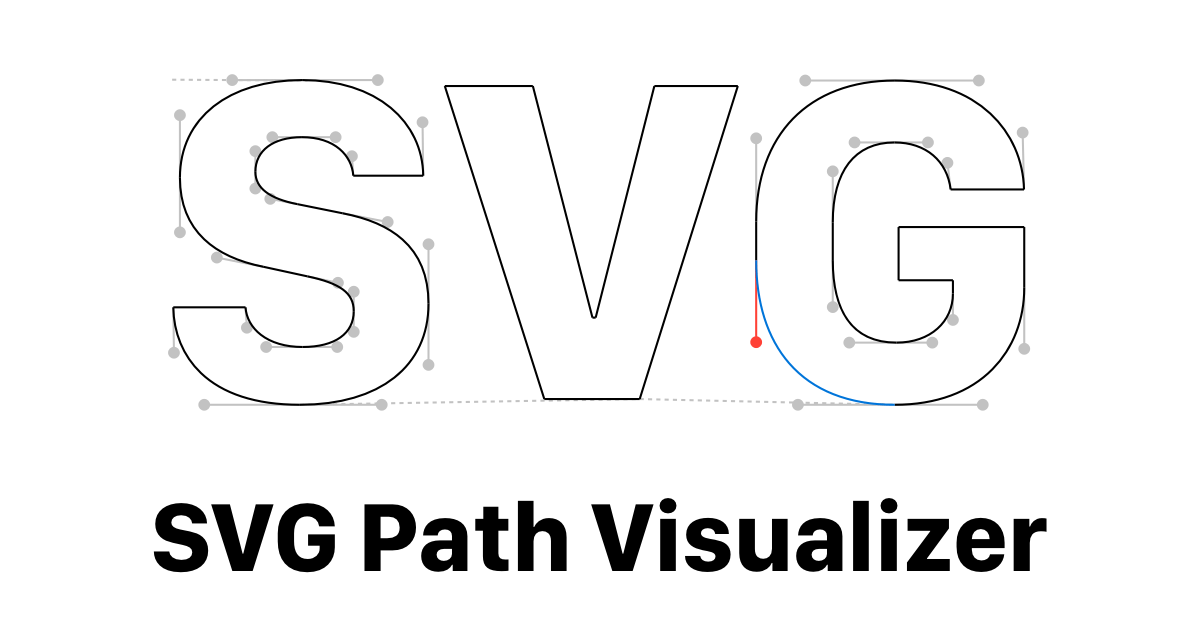
SVG Path Visualizer
Enter an SVG path data (the string inside the `d` attribute) to visualize it and discover all its different commands.
Check it out and if you find it useful, star the SVG Path Visualizer Repository on GitHub.
Resources